
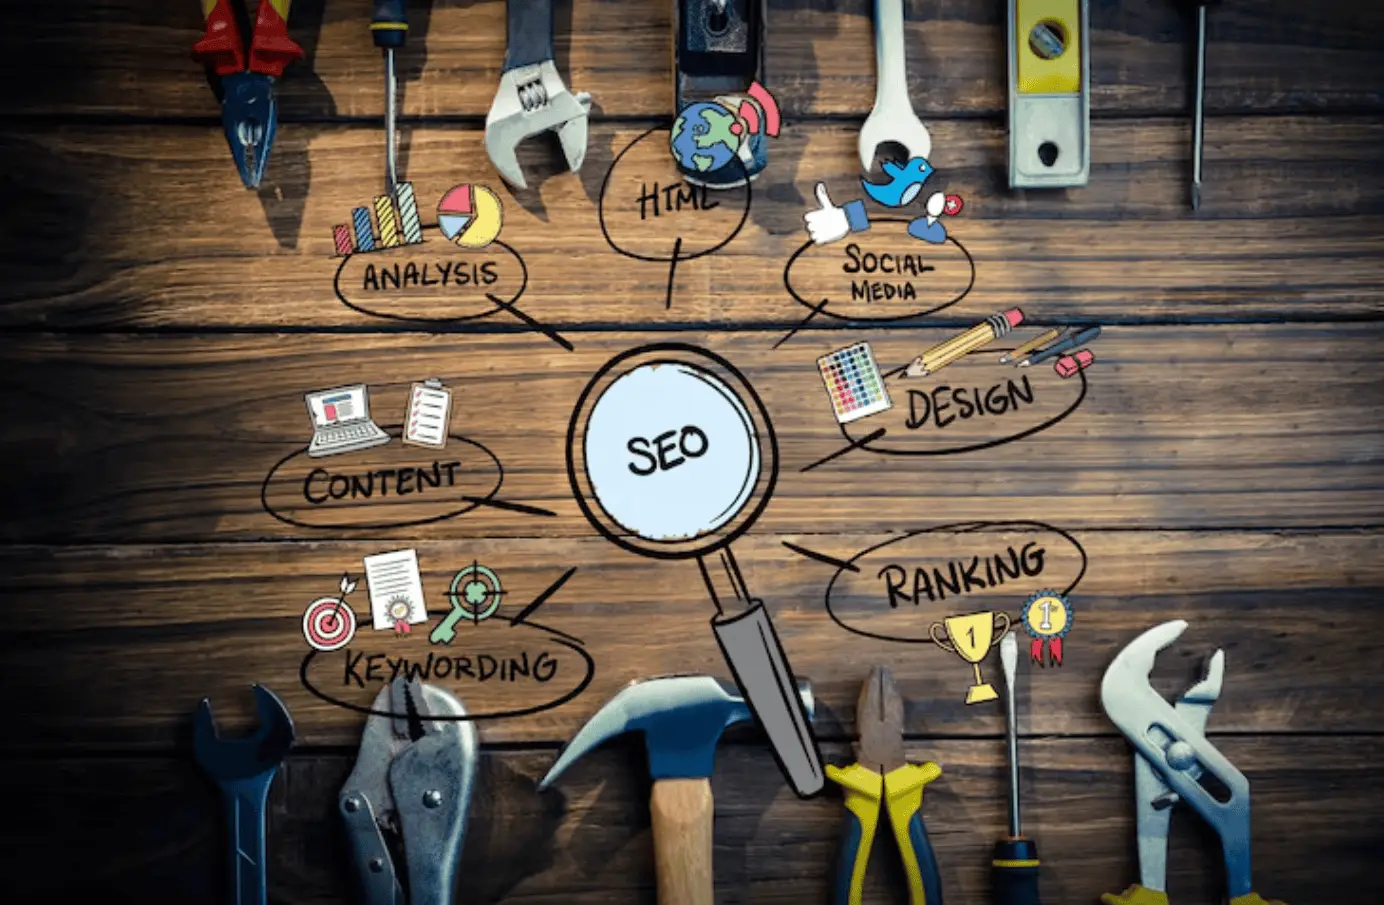
Source: Freepik
You want real SEO insight, not scattered metrics. Combine GSC for queries and SERP impact, GA4 for user paths, and a third-party tool for backlinks and competitors. Link GSC to GA4, then layer in regions like Hong Kong for clean comparisons. Add CRM data to track leads, not just sessions. Set alerts for drops and wins. With this stack, you’ll see what moves the needle—now let’s map how to make it work for you.
Why You Need Multiple Data Sources for Accurate SEO Analysis
Even if one tool looks enough, it isn’t. You need more than a single view. Each platform samples, filters, or delays data in its own way. That skews trends. It also hides edge cases. With source diversification, you balance blind spots. You compare numbers, then ask why they differ. That boosts data reliability. It also sharpens your next test.
Use multiple logs, crawlers, and rank trackers. Cross-check clicks, sessions, and positions. Map terms to pages. Match pages to intent. Verify changes by date. Tie shifts to updates. When signals align, you gain analytical accuracy. When they don’t, you learn faster. You spot bugs, spam, or mis-tags. You see wins sooner. You act with confidence. One view guesses. Many views prove.
What Google Search Console Shows That Analytics Tools Do Not
While GA4 tracks what users do after they arrive, Google Search Console shows how they found you. You see queries, impressions, and average position. You see clicks by country, device, and page. You spot featured snippets and rich results. You catch index issues and manual actions. You view crawl stats and sitemaps. These are GSC unique insights.
GA4 limitations appear fast. GA4 hides most queries. It samples some reports. It depends on tags and consent. It can miss bot filters and dark traffic. That creates SEO data discrepancies.
In GSC, you compare query trends to pages. You test titles with CTR. You find cannibalization. You validate fixes. You confirm live coverage. You track core updates by query. You see intent shifts before traffic drops.
How Google Analytics 4 Tracks User Behavior After the Click
After the click, GA4 shows what users do on your site. You see events, not sessions. Each view, scroll, click, and file download is an event. You can track form starts and submits. You can mark key steps as conversions. You get clean paths and funnels. This helps with user journey mapping. You learn where people drop, and why they stay.
Use click through analysis to link landing pages to actions. Check engagement metrics like engaged sessions, time, and scroll depth. Spot content that keeps people. Find pages that need work. Compare new and returning users. Segment by source and device. Build audiences from behavior. Test changes and watch event counts move. Tie actions to revenue. Then plan edits that raise real outcomes.
Gaps Between GSC and GA4 Data and How to Close Them
Because GSC and GA4 measure different things in different ways, their numbers won’t match. You’ll see clicks vs sessions, queries vs pages, and sampling vs modeled data. That’s normal. The gap comes from filters, consent loss, and blocked cookies. GA4 tracking limitations also hide some organic visits. GSC data discrepancies appear when you compare different date zones, page groups, or URL versions.
Close gaps with tight scoping. Match date ranges, countries, and devices. Compare by landing page, not query. Use the same URL canonicals. Exclude brand terms when you check intent. Annotate site changes and SERP shifts. Validate events and default channel rules. Spot-check with server logs. Then do SEO insight integration: align trends, not totals. Use deltas to prioritize fixes and opportunities.
Connecting Google Search Console and Google Analytics 4 for Unified Reporting
Even if their numbers won’t match, you can link Google Search Console and GA4 to see search and site behavior in one view. Start in GA4 Admin. Add the GSC link to your property. Pick the right web data stream. Verify the site matches your GSC property. Save the link.
Use GSC integration strategies to map search terms to landing pages. Compare queries, clicks, and average position with GA4 sessions and engagement. Tag key actions with GA4 event tracking, like scroll, file download, or lead form submit. Tie events to landing pages that earn impressions.
Apply unified reporting techniques. Build segments for branded and non‑branded queries. Align country and device filters. Use the same date ranges. Track change after content updates. Flag pages with high impressions but weak engagement. Prioritize fixes.
Using Looker Studio to Build Combined SEO Dashboards
When you need one place to see SEO and engagement, Looker Studio brings GSC, GA4, and third‑party data together fast. You connect sources in minutes. You pick fields you trust. Then you shape clear views for action.
Use key Looker Studio features. Build filters for brand vs non‑brand. Add date controls for quick trends. Set blended charts only when needed. Keep Dashboard design simple. Group KPIs at the top. Place detail below. Use clear labels and light color.
Apply data visualization techniques that tell truth fast. Use scorecards for clicks, sessions, and CTR. Use time‑series lines for seasonality. Use bar charts for landing pages and devices. Add conditional formatting to spot drops. Document metric notes. Lock layouts to keep performance smooth. Save templates for teams.
Blending Keyword Data from GSC with Conversion Data from GA4
Although each tool has limits, you can join GSC queries with GA4 conversions to see which keywords drive real value. Pull GSC query, clicks, and position. Match landing pages to GA4 sessions and conversions. Use a clean key, like the page path, to blend. Then map each query to its page.
Review keyword performance metrics. Compare clicks, CTR, and average position with conversion rate and revenue. Flag queries with high intent and low conversions. That signals page or funnel issues.
Run search intent analysis. Group queries by intent: informational, commercial, transactional. Align pages and CTAs to intent. Test new copy and internal links. Track conversion rate optimization lifts by query group. Pause efforts on queries that rank but don’t convert. Double down on terms that convert at scale.
Adding Backlink Data from Ahrefs or Semrush
Backlinks add context your keyword and conversion data can’t. Pull Ahrefs or Semrush into your GSC and GA4 view. You’ll see where authority flows. Map landing pages with clicks and leads to their top links. Spot gaps. Find pages that convert but lack links. Build plans fast.
Use backlink analysis tools to audit your profile. Check backlink quality metrics like DR/Authority, topical fit, anchor text, and link type. Remove spam. Flag risky patterns. Compare link growth to changes in impressions and sessions.
Plan backlink acquisition strategies from what works. Clone patterns behind winning pages. Target similar domains and topics. Refresh old assets that once earned links. Prioritize links to pages with strong intent in GA4. Track new links against rank and revenue. Iterate.
Using Log File Analysis Tools Alongside GSC and GA4
You’ve mapped links and flagged risks. Now check what bots do. Use log file tools with GSC and GA4. You’ll see crawls, hits, and gaps. GSC shows queries and clicks. GA4 shows users and events. Logs show every bot request. Merge them to boost data accuracy and trust.
- Spot crawl waste on faceted URLs, filters, and junk paths.
- Compare bot hits to GA4 loads to find slow pages and errors.
- Verify indexation fixes by checking crawl return after changes.
Tie crawl rate to server response codes. Fix 404s, 500s, and loops fast. Map logs to sitemaps and robots rules. Reduce crawl budget drain. Prioritize pages with traffic and revenue. You’ll get clear SEO insights. Act on facts, not guesses. Then monitor logs weekly.
Identifying Cannibalization with Combined Query and Landing Page Data
When pages fight for the same query, rankings slip and clicks scatter. You need clean data. Start in GSC. Pull queries, pages, impressions, and clicks. Group by query. Flag query overlap where two or more URLs earn impressions for the same term. That’s your cannibalization analysis.
Now layer GA4. Match those URLs to sessions and engagement. See which page keeps users. See which one bounces. Add third‑party tools for intent, SERP features, and links. Confirm which URL best fits the query.
Decide winners and supporting pages. Do landing page optimization on the winner. Tighten titles, H1s, and internal links. Merge near‑duplicates. Use canonicals when needed. Redirect weak variants. Map each query to one primary URL. Monitor weekly. Keep the set stable. Protect gains.
Measuring True SEO ROI by Mapping Queries to Revenue
Although traffic looks good on charts, real SEO value shows in revenue tied to queries. You need query revenue mapping. Pull queries and pages from GSC. Join them with GA4 transactions. Tie each click path to order IDs. Use UTMs and source/medium rules. Then split revenue by query. Now you’re tracking organic sales, not just visits.
Tag branded and non‑branded terms. Compare assisted and last‑click. Spot gaps in attribution. Feed this into budget and roadmap. Pause weak terms. Push winners. Keep your data fresh. Refresh mappings weekly.
- Build a query-to-URL dictionary from GSC, then merge GA4 item revenue by session
- Create cohorts for new vs returning users to see lifetime value by query
- Use margins, not topline, when optimizing keyword performance
Tracking AI Crawler Traffic with Logs and Comparing to GSC Impressions
Revenue mapping shows what pays. Now track how AI bots touch your site. Start with server logs. Filter by user agents for major AI crawlers. Do crawler traffic analysis by path, status code, and frequency. Note crawl spikes and thin pages hit. Use log file comparison across weeks to spot trends.
Match this with Google Search Console. Pull impressions and queries by page. Use clear impression tracking methods. Compare crawled URLs to pages with rising or falling impressions. If bots crawl but impressions stay flat, check indexation or content gaps. If impressions rise but crawl is low, improve internal links.
Tag bot hits in GA4 with custom dimensions. Exclude them from user metrics. Build a sheet. Join logs, GSC, and GA4. Flag wins. Flag waste. Move fast.
Using Third Party Rank Tracking Tools for Local Hong Kong Results
Maps and markets shape local SEO in Hong Kong. Use third‑party rank trackers to see real, local SERP shifts. Set locations by district. Test English, Traditional Chinese, and mixed queries. Track map pack and organic. You’ll spot gaps fast. Use local keyword strategies to match search intent by area and language. Then plan pages and GMB updates. Keep refining and optimizing local content as results move.
- Set geo targets: Central, Tsim Sha Tsui, Sha Tin, and more. Test mobile first. Track map pack ranks.
- Use competitor analysis tools to watch features won: reviews, posts, sitelinks, FAQs. Copy what works, improve it.
- Build keyword groups by cantonese phrasing, brand + service, and “near me.” Map each group to a page or GMB section.
Combining GSC Data with GA4 for Hong Kong Ecommerce Insights
Even with many channels, you can link GSC and GA4 to see what search drives real sales in Hong Kong. Connect them. Map queries to landing pages, then to purchases. Use GA4 conversions and revenue. Filter by source/medium and country. Spot which keywords lead to carts, checkout, and repeat orders.
Pull GSC clicks, impressions, and CTR. Compare to GA4 sessions and ROAS. You’ll find gaps where you rank but don’t earn. Fix titles, content, and offers. Track ecommerce trends by product, brand, and season. Run competitive analysis on shared queries and SERP features. Benchmark your share of clicks.
Segment by device and customer demographics in GA4. Check new vs. returning users. See where Hong Kong shoppers drop. Prioritize pages with high intent and low friction.
Measuring SEO Performance for Hong Kong Bilingual, English and Chinese, Sites
While Hong Kong users switch between English and Chinese, you need clean tracking to judge SEO. Set up GA4 with language parameters. Segment by page language, query language, and user locale. Use GSC to split English and Chinese performance. Map clicks, CTR, and positions by language. Tie sessions to revenue and leads. Track SERP features in both scripts. Benchmark with third-party tools. Use bilingual keyword strategies to cover mixed intent. Watch local market trends to spot shifts fast. Apply competitor analysis techniques for gaps and ideas. Report wins by language.
- Build language-specific dashboards that align GSC queries with GA4 sessions
- Monitor internal search and on-site toggles to find language friction
- Compare backlinks and anchors by language to guide outreach and PR
Tracking Brand Versus Non Brand Queries in the Hong Kong Market
How do you split brand and non-brand cleanly in Hong Kong’s bilingual search? Start with GSC queries. Build regex lists for your brand in English and Chinese. Include misspellings and Cantonese slang. Tag everything else as non-brand. Sync this to GA4 with query groupings. Then map landing pages to intent.
Use brand performance metrics to judge demand and loyalty. Track CTR, position, and branded click share by language. Watch spikes tied to PR or offline ads. Compare desktop and mobile.
For growth, lean on non brand keyword strategies. Find gaps with third-party tools. Pull competitors’ Cantonese terms. Check local search trends for seasonality and phrasing. Test long-tail questions. Measure conversions and assisted revenue in GA4. Refresh your lists monthly. Recheck mappings after site changes.
Comparing Hong Kong Organic Traffic to Other APAC Regions
Before you compare Hong Kong to other APAC markets, align your data. Set the same date range in GSC and GA4. Match channel groups. Use the same device, page type, and query filters. Then pull benchmarks from third‑party tools. Build an APAC comparison with clear segments. Look at Organic traffic trends, not one‑off spikes. Track share of clicks, CTR, and position. Check seasonality and holidays by market.
Use GA4 to segment by country and language. Use GSC for query and SERP shifts. Validate with a third‑party visibility score. Plot week over week and year over year. Flag anomalies and test causes fast.
- Normalize by population and search volume per market
- Compare branded mix and SERP features by region
- Map content gaps unique to Hong Kong versus APAC peers
Integrating CRM Data to Tie SEO to Leads in Hong Kong
Even if your SEO looks strong in GSC and GA4, it won’t prove value until you connect it to leads in your CRM. You need clean mapping from keyword to session to contact. Use UTM rules and hidden fields on Hong Kong forms. Pass gclid or source/medium to the CRM. Pick CRM Integration Techniques that preserve first touch and last touch.
Sync GA4 events to a lead object. Push landing page, query term, city, and language. Tag Cantonese pages and Hong Kong SERP traffic. Tackle Data Synchronization Challenges early. Standardize time zones, currencies, and character sets. Validate consent for PDPO.
Score leads from organic with simple Lead Generation Strategies. Tie revenue stages to SEO touchpoints. Build a dashboard that shows visits, MQLs, SQLs, and won deals by keyword.
Building Automated SEO Alerts for Hong Kong Based Campaigns
While your dashboards show trends, alerts catch change fast. You need signals before drops hurt. Build an automated alerts setup that blends GSC, GA4, and a third‑party monitor. Track Hong Kong SERP shifts, page speed, and crawl health. Set alert rules by market, device, and language. Use HKT to time checks. Tie spikes and dips to releases or outages. Keep thresholds tight but not noisy. Aim for data driven decisions that fit Hong Kong SEO.
- Watch GSC for CTR dips on Cantonese pages after 9 p.m. HKT
- Flag GA4 landing pages when bounce jumps 20% from median
- Ping uptime and Core Web essentials for .hk sections hourly
Route alerts to Slack and email. Add labels. Review weekly. Prune false positives fast.
Creating a Long Term SEO Reporting Framework for Hong Kong Businesses
Those alerts keep you sharp day to day. Now build a framework that lasts. Set clear goals and KPIs. Tie them to revenue, leads, and lifetime value. Use GA4 for conversions and cohorts. Use GSC for queries and CTR. Map both to landing pages and themes.
Create monthly and quarterly views. Track long term strategies against local market trends. Add competitive analysis with third‑party tools. Benchmark share of voice, rankings, and backlinks. Tag content by intent and language. Include Cantonese and English.
Standardize dashboards. Lock naming, filters, and UTM rules. Log tests, changes, and seasonality notes. In Hong Kong, reflect retail peaks and typhoon dips. Add alerts for sudden drops, but judge by trend lines. Review, decide, act. Archive reports. Build a repeatable loop.
Conclusion
You now see how to blend GSC, GA4, and third-party tools for real SEO insight. Use GSC for queries and SERP truth. Use GA4 for users after the click. Fill gaps with aligned filters and shared IDs. Connect both for one view. Compare Hong Kong to APAC to spot wins and gaps. Tie CRM to prove leads and revenue. Set alerts to react fast. Build a long-term report. Then test, learn, and keep improving.